
Kubernetes部署Prometheus
系统环境
- Kubernetes 版本: 1.20.0
- Docker 版本: 19.03.13
- 操作系统: CentOS 7.6
Prometheus 版本: 2.36.0
参考地址
Prometheus 简介
Prometheus 是什么
Prometheus 是在 SoundCloud 上构建并开源的系统监视和警报工具包。自 2012 年成立以来,许多公司和组织都采用 Prometheus,该项目拥有非常活跃的开发人员和用户社区。不过它现在已经成为一个独立的开源项目,并且独立于任何公司进行维护。为了强调这一点并澄清项目的治理结构,Prometheus 于 2016 年加入了云原生计算基金会,成为继 Kubernetes 之后的第二个毕业项目
Prometheus 特征
Prometheus 主要特征如下:
- 多维数据模型(时序列数据由 metric 名和一组 key/value 组成)
- 提供 PromQL,这是一种灵活的查询语言,可以利用多维数据完成复杂的查询
- 不依赖 分布式存储,支持服务器 本地存储
- 基于 HTTP 的 Pull 方式采集时间序列数据
- 通过 PushGateway 可以支持 Push 模式推送 时间序列
- 可以通过 动态服务发现 或 静态配置 等方式发现目标对象
- 多种可视化和仪表盘支持
Prometheus 组成
Prometheus 生态系统包含多个组件,其中许多是可选的:
- Prometheus 主服务器: 用于抓取指标、存储时间序列数据
- Client libraries: 用于检测应用程序代码
- PushGateway: 支持短期工作的推送网关
- Alertmanager: 用于处理报警的组件
- 支持 HAProxy、StatsD、Graphite 等服务的特殊用途出口商
- …(其它工具)
Prometheus架构
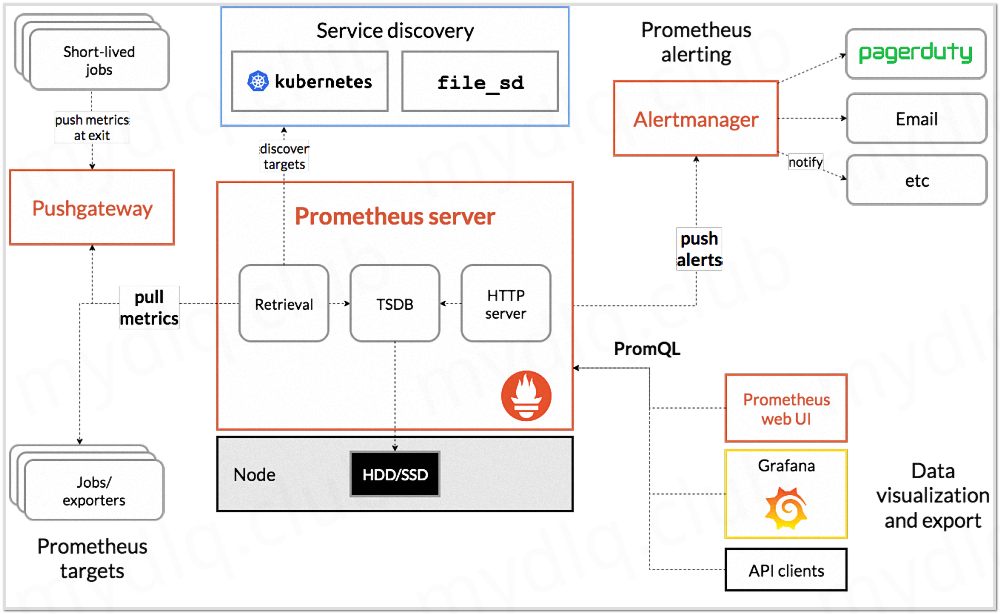
Prometheus 直接或者通过中间件 PushGateway 中获取指标数据,它将所有收集到的指标样本存储在本地,并对这些数据按照一定规则进行运算,以汇总和记录现有的数据组的新的时间序列或者生成报警规则。而 Grafana 或者其它 API 使用者可以通过这些收集的指标数据进行可视化展示
Promethues适合场景
什么时候适合使用 Prometheus
Prometheus 非常适合记录任何纯数字时间序列。它既适合以机器为中心的监控,也适合监控高度动态的面向服务的体系结构。在微服务世界中,其对多维数据收集和查询的支持是一种特别的优势。 Prometheus 是为可靠性而设计的,在出现故障时,你可以使用该系统快速诊断问题。每个 Prometheus 服务器都是独立的,而不依赖于网络存储或其他远程服务。当基础结构的其他部分损坏时单独依赖它就行,而且不需要设置大量的基础设施来使用它
什么时候不适合使用 Prometheus
Prometheus 注重可靠性。可以随时查看有关系统的可用统计信息,集成在出现故障的情况下也是如此。如果需要保证 100% 的数据准确性(例如按照请求数进行收费)则 Prometheus 并不是一个很好的选择,因为收集的数据可能不够详细和完整
k8s部署prometheus
本文通过两种方式部署,分别为Deployment和StatefulSet,具体选择请根据业务实际情况决定
部署prometheus RBAC
创建 Prometheus 部署 Kubernetes 所需的 RBAC 资源文件 prometheus-rbac.yam
[root@k8s01 monitoring]# vim prometheus-rbac.yaml
apiVersion: v1
kind: ServiceAccount
metadata:
  name: prometheus
  namespace: monitoring
---
apiVersion: rbac.authorization.k8s.io/v1
kind: ClusterRole
metadata:
  name: prometheus
rules:
- apiGroups: [""]
  resources: ["nodes","nodes/proxy","services","endpoints","pods"]
  verbs: ["get", "list", "watch"]
- apiGroups: ["extensions"]
  resources: ["ingress"]
  verbs: ["get", "list", "watch"]
- nonResourceURLs: ["/metrics"]
  verbs: ["get"]
---
apiVersion: rbac.authorization.k8s.io/v1
kind: ClusterRoleBinding
metadata:
  name: prometheus
roleRef:
  apiGroup: rbac.authorization.k8s.io
  kind: ClusterRole
  name: cluster-admin
subjects:
- kind: ServiceAccount
  name: prometheus
  namespace: monitoring

#部署
[root@k8s01 monitoring]# kubectl apply -f prometheus-rbac.yaml
serviceaccount/prometheus created
clusterrole.rbac.authorization.k8s.io/prometheus created
clusterrolebinding.rbac.authorization.k8s.io/prometheus created
部署prometheus存储
本文采用nfs动态生成pvc存储
[root@k8s01 monitoring]# vim prometheus-pvc.yaml
apiVersion: v1
kind: PersistentVolumeClaim
metadata:
  name: prometheus-pvc
  namespace: monitoring
  labels:
    app: prometheus
spec:
  accessModes:
    - ReadWriteMany
  resources:
    requests:
      storage: 50Gi
  storageClassName: managed-nfs-storage

[root@k8s01 monitoring]# kubectl apply -f prometheus-pvc.yaml
persistentvolumeclaim/prometheus-pvc created
创建prometheus配置
prometheus配置文件是经常改动的文件,推荐将该配置文件内容存储到kubernetes的 ConfigMap中,方便进行更改配置内容,创建 Prometheus 配置文件 prometheus-config.yaml
[root@k8s01 monitoring]# vim prometheus-config.yaml
apiVersion: v1
kind: ConfigMap
metadata:
  name: prometheus-config
  namespace: monitoring
data:
  prometheus.yml: |
    global:
      scrape_interval:     15s
      evaluation_interval: 15s
      external_labels:
        cluster: "kubernetes"

    scrape_configs:
    - job_name: prometheus
      static_configs:
      - targets: ['127.0.0.1:9090']
        labels:
          instance: prometheus
[root@k8s01 monitoring]# kubectl apply -f prometheus-config.yaml
configmap/prometheus-config created
部署prometheus
Deployment部署
创建 Prometheus 部署文件 prometheus-deploy.yaml
[root@k8s01 monitoring]# cat prometheus-deploy.yaml
apiVersion: v1
kind: Service
metadata:
  name: prometheus
  namespace: monitoring
  labels:
    k8s-app: prometheus
spec:
  type: NodePort
  ports:
  - name: http
    port: 9090
    targetPort: 9090
    nodePort: 30089
  selector:
    k8s-app: prometheus
---
apiVersion: apps/v1
kind: Deployment
metadata:
  name: prometheus
  namespace: monitoring
  labels:
    k8s-app: prometheus
spec:
  replicas: 1
  selector:
    matchLabels:
      k8s-app: prometheus
  template:
    metadata:
      labels:
        k8s-app: prometheus
    spec:
      serviceAccountName: prometheus
      containers:
      - name: prometheus
        image: prom/prometheus:v2.36.0
        imagePullPolicy: IfNotPresent
        ports:
        - name: http
          containerPort: 9090
        securityContext:
          runAsUser: 65534
          privileged: true
        command:
        - "/bin/prometheus"
        args:
        - "--config.file=/etc/prometheus/prometheus.yml"
        - "--web.enable-lifecycle"
        - "--storage.tsdb.path=/prometheus"
        - "--storage.tsdb.retention.time=10d"
        - "--web.console.libraries=/etc/prometheus/console_libraries"
        - "--web.console.templates=/etc/prometheus/consoles"
        resources:
          limits:
            cpu: 2000m
            memory: 1024Mi
          requests:
            cpu: 1000m
            memory: 512Mi
        readinessProbe:
          httpGet:
            path: /-/ready
            port: 9090
          initialDelaySeconds: 5
          timeoutSeconds: 10
        livenessProbe:
          httpGet:
            path: /-/healthy
            port: 9090
          initialDelaySeconds: 30
          timeoutSeconds: 30
        volumeMounts:
        - name: data
          mountPath: /prometheus
          subPath: prometheus
        - name: config
          mountPath: /etc/prometheus
      - name: configmap-reload
        image: jimmidyson/configmap-reload:v0.5.0
        imagePullPolicy: IfNotPresent
        args:
        - "--volume-dir=/etc/config"
        - "--webhook-url=http://localhost:9090/-/reload"
        resources:
          limits:
            cpu: 100m
            memory: 100Mi
          requests:
            cpu: 10m
            memory: 10Mi
        volumeMounts:
        - name: config
          mountPath: /etc/config
          readOnly: true
      volumes:
      - name: data
        persistentVolumeClaim:
          claimName: prometheus-pvc
      - name: config
        configMap:
          name: prometheus-config
部署的 Deployment 资源文件中的 containers 部分配置了两个容器,分别是:
- prometheus: Prometheus 容器是主容器,用于运行 Prometheus 进程
- configmap-reload: 用于监听指定的 ConfigMap 文件中的内容,如果内容发生更改,则执行 webhook url 请求,因为 Prometheus 支持通过接口重新加载配置文件,所以这里使用这个容器提供的机制来完成 Prometheus ConfigMap 配置文件内容一有更改,就执行 Prometheus 的 /-/reload 接口,进行更新配置操作
上面资源文件中 Prometheus 参数说明:
- –web.enable-lifecycle: 启用 Prometheus 用于重新加载配置的 /-/reload 接口
- –config.file: 指定 Prometheus 配置文件所在地址,这个地址是相对于容器内部而言的
- –storage.tsdb.path: 指定 Prometheus 数据存储目录地址,这个地址是相对于容器而言的
- –storage.tsdb.retention.time: 指定删除旧数据的时间,默认为 15d
- –web.console.libraries: 指定控制台组件依赖的存储路径
- –web.console.templates: 指定控制台模板的存储路径
StatefulSet部署
创建Prometheus部署文件 prometheus-statefulset.yaml
[root@k8s01 monitoring]# vim prometheus-statefulset.yaml
apiVersion: apps/v1
kind: StatefulSet
metadata:
  name: prometheus
  namespace: monitoring
  labels:
    k8s-app: prometheus
spec:
  serviceName: "prometheus"
  replicas: 2
  podManagementPolicy: "Parallel"
  selector:
    matchLabels:
      k8s-app: prometheus
  template:
    metadata:
      labels:
        k8s-app: prometheus
    spec:
      serviceAccountName: prometheus
      initContainers:
      - name: "init-chown-data"
        image: "busybox:latest"
        imagePullPolicy: "IfNotPresent"
        command: ["chown", "-R", "65534:65534", "/data"]
        volumeMounts:
        - name: prometheus-data
          mountPath: /data
          subPath: ""
      containers:
        - name: prometheus-server-configmap-reload
          image: "jimmidyson/configmap-reload:v0.5.0"
          imagePullPolicy: "IfNotPresent"
          args:
            - --volume-dir=/etc/config
            - --webhook-url=http://localhost:9090/-/reload
          volumeMounts:
            - name: config-volume
              mountPath: /etc/config
              readOnly: true
          resources:
            limits:
              cpu: 10m
              memory: 10Mi
            requests:
              cpu: 10m
              memory: 10Mi

        - name: prometheus-server
          image: "prom/prometheus:v2.36.0"
          imagePullPolicy: "IfNotPresent"
          args:
            - --config.file=/etc/config/prometheus.yml
            - --storage.tsdb.path=/data
            - --storage.tsdb.retention.time=10d
            - --web.console.libraries=/etc/prometheus/console_libraries
            - --web.console.templates=/etc/prometheus/consoles
            - --web.enable-lifecycle
          ports:
            - containerPort: 9090
          readinessProbe:
            httpGet:
              path: /-/ready
              port: 9090
            initialDelaySeconds: 30
            timeoutSeconds: 30
          livenessProbe:
            httpGet:
              path: /-/healthy
              port: 9090
            initialDelaySeconds: 30
            timeoutSeconds: 30
          resources:
            limits:
              cpu: 200m
              memory: 1000Mi
            requests:
              cpu: 200m
              memory: 1000Mi
          volumeMounts:
            - name: config-volume
              mountPath: /etc/config
            - name: prometheus-data
              mountPath: /data
              subPath: ""
      terminationGracePeriodSeconds: 300
      volumes:
        - name: config-volume
          configMap:
            name: prometheus-config
  volumeClaimTemplates:
  - metadata:
      name: prometheus-data
    spec:
      storageClassName: managed-nfs-storage #存储类根据自己的存储类名字修改
      accessModes:
        - ReadWriteOnce
      resources:
        requests:
          storage: "50Gi"
---
apiVersion: v1
kind: Service
metadata:
  name: prometheus
  namespace: monitoring
  labels:
    k8s-app: prometheus
spec:
  type: NodePort
  ports:
  - name: http
    port: 9090
    targetPort: 9090
    nodePort: 30089
  selector:
    k8s-app: prometheus
访问prometheus UI界面
部署 Prometheus 中设置其 Service 模式为 NodePort 模式,端口号为 30089,可以使用 NodePort 的端口访问 Prometheus,输入IP:30089 访问Prometheus页面
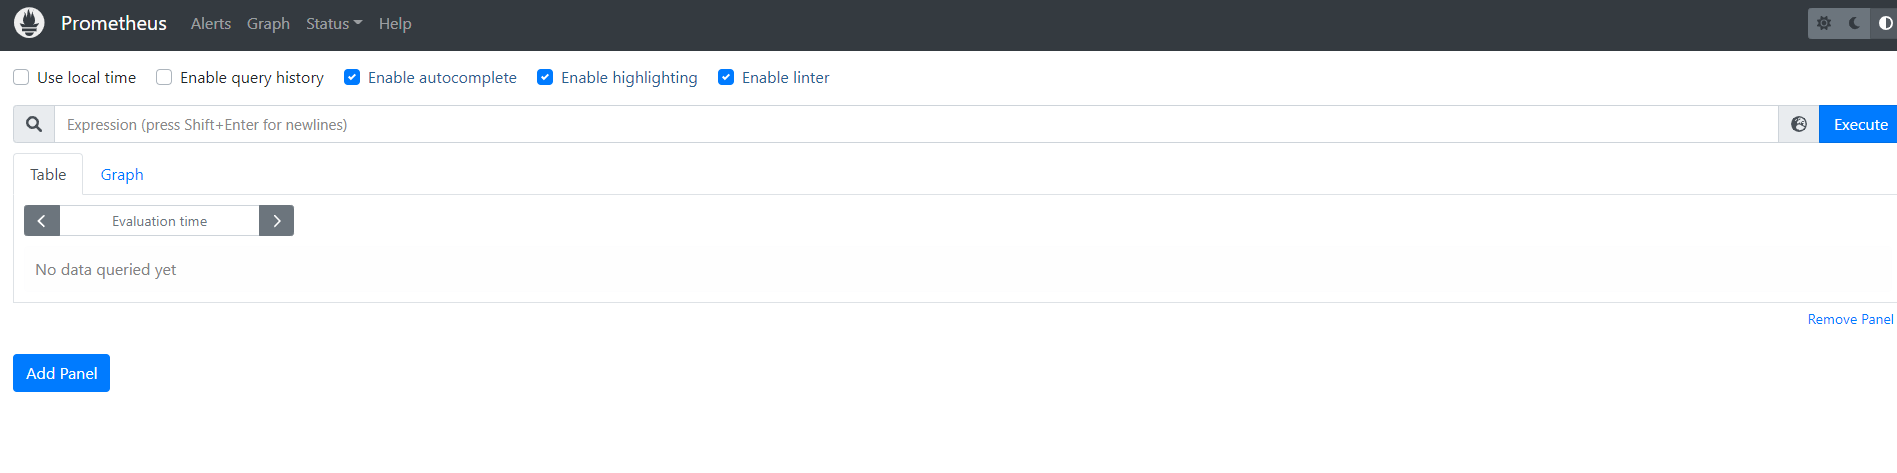
上述web页面就是prometheus提供的看板,可以通过页面很方便的执行PromQL查询 Prometheus中的时间序列数据,还能够通过该页面查看Prometheus配置内容与告警规则
 微信
微信
 支付宝
支付宝