
Prometheus监控服务进程
在prometheus中,process-exporter 可以用来检测所选进程的存活状态,比如某个服务的进程数、消耗了多少CPU、内存等资源
process-exporter部署
下载process-exporter
- process-exporter GibHUB地址
- process-exporter 下载地址
process-exporter可以使用命令行参数也可以指定配置文件启动
配置process-exporter
[root@k8s01 ~]# vim /usr/local/process-exporter/process_name.yaml
process_names:

  - name: "{{.Matches}}"
    cmdline:
    - 'nginx'
  - name: "{{.Matches}}"
    cmdline:
    - '/opt/atlassian/confluence/bin/tomcat-juli.jar'
  - name: "{{.Matches}}"
    cmdline:
    - 'vsftpd'
  - name: "{{.Matches}}"
    cmdline:
    - 'redis-server'
cmdline: 所选进程的唯一标识,ps -ef 可以查询到。如果改进程不存在,则不会有该进程的数据采集到
例如:
[root@k8s01 ~]# ps -ef|grep redis
redis 4317 4237 0 Oct21 ? 10:30:12 redis-server *:6379
| {{.Comm}} | groupname=”redis-server” | exe或者sh文件名称 |
|---|---|---|
| {{.ExeBase}} | groupname=”redis-server*:6379” | / |
| {{.ExeFull}} | groupname=”/usr/bin/redis-server *:6379” | ps中的进程完成信息 |
| {{.Username}} | groupname=”redis” | 使用进程所属的用户进行分组 |
| {{.Matches}} | groupname=”map[:redis]” | 表示配置到关键字“redis” |
配置systemd管理启动
[root@k8s01 ~]# vim /usr/lib/systemd/system/process_exporter.service

[Unit]
Description=Prometheus exporter for processors metrics, written in Go with pluggable metric collectors.
Documentation=https://github.com/ncabatoff/process-exporter
After=network.target

[Service]
Type=simple
User=prometheus
WorkingDirectory=/usr/local/process-exporter
ExecStart=/usr/local/process-exporter/process-exporter -config.path=/usr/local/process-exporter/process_name.yaml
Restart=on-failure

[Install]
WantedBy=multi-user.target
启动process-exporter
[root@k8s01 ~]# systemctl daemon-reload
[root@k8s01 ~]# systemctl start process_exporter
[root@k8s01 ~]# systemctl enable process_exporter
验证监控数据
[root@k8s01 ~]# curl http://localhost:9256/metrics
prometheus配置
由于已经通过k8s部署prometheus并使用了ConfigMap资源存储Prometheus配置文件,所以需要对Prometheus配置文件进行改动,就需要修改ConfigMap资源文件prometheus-config.yaml
[root@k8s01 prometheus]# vim prometheus-config.yaml
apiVersion: v1
kind: ConfigMap
metadata:
  name: prometheus-config
  namespace: monitoring
data:
  prometheus.yml: |
    global:
      scrape_interval:     15s
      evaluation_interval: 15s
      external_labels:
        cluster: "kubernetes"
...
    - job_name: 'process'
      scrape_interval: 30s
      scrape_timeout: 15s
      static_configs:
      - targets: ['192.168.200.73:9256']
...
重新加载新的配置
[root@k8s01 prometheus]# curl -X POST http://10.x.x.x:30089/-/reload
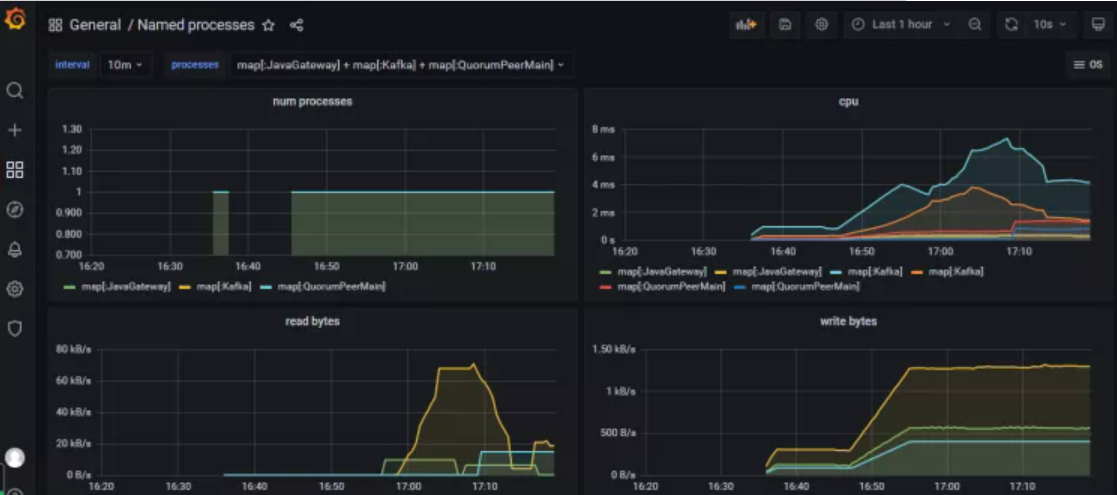
grafana引入图表
process-exporter对应的dashboard为:https://grafana.com/grafana/dashboards/249
Prometheus配置告警
编辑修改ConfigMap资源文件prometheus-config.yaml
[root@k8s01 prometheus]# vim prometheus-config.yaml
apiVersion: v1
kind: ConfigMap
metadata:
  name: prometheus-config
  namespace: monitoring
data:
...
  process-rule.yml: |
   - name: 进程告警
      rules:
      - alert: 进程告警
        expr: sum(namedprocess_namegroup_states) by (cluster,job,instance) > 500
        for: 20s
        labels:
          severity: error
        annotations:
          value: 服务器当前已产生 {{ $value }} 个进程,大于告警阈值

   - name: 进程告警
      rules:
      - alert: 进程告警
        expr: sum by(cluster, job, instance, groupname) (namedprocess_namegroup_states{state="Zombie"}) > 0
        for: 1m
        labels:
          severity: error
        annotations:
          value: 当前产生 {{ $value }} 个僵尸进程

   - name: 进程重启告警
      rules:
      - alert: 进程重启告警
        expr: ceil(time() - max by(cluster, job, instance, groupname) (namedprocess_namegroup_oldest_start_time_seconds)) < 60
        for: 25s
        labels:
          severity: error
        annotations:
          value: 进程 {{ $labels.groupname }} 在 {{ $value }} 秒前发生重启

   - name: 进程退出告警
      rules:
      - alert: 进程退出告警
        expr: up{export="process_exporter"} == 0 or max by(cluster, job, instance, groupname) (delta(namedprocess_namegroup_oldest_start_time_seconds{groupname=~"^map.*"}[10d])) < 0
        for: 20s
        labels:
          severity: error
        annotations:
          value: 进程 {{ $labels.export}} 已退出
版权声明:
本站所有文章除特别声明外,均采用 CC BY-NC-SA 4.0 许可协议。转载请注明来自
爱吃可爱多!
喜欢就支持一下吧
打赏
 微信
微信
支付宝
 微信
微信
 支付宝
支付宝