
Prometheus监控ssl证书
https证书突然过期,导致某个业务出现问题,这个问题还是存在,本文通过blackbox exporter来监控ssl证书到期时间,由于之前已经部署blackbox,这里就不复述k8s部署blackbox
Prometheus配置blackbox采集
由于已经基于k8s部署prometheus,且将其配置参数写到ConfigMap资源中,然后通过挂载ConfigMap到Pod内部,这样修改ConfigMap就可以修改Prometheus配置
[root@k8s01 prometheus]# vim prometheus-config.yaml
apiVersion: v1
kind: ConfigMap
metadata:
  name: prometheus-config
  namespace: monitoring
data:
  prometheus.yml: |
    global:
      scrape_interval:     15s
      evaluation_interval: 15s
      external_labels:
        cluster: "kubernetes"

    alerting:
      alertmanagers:
      - static_configs:
        - targets: ["alertmanager:9093"]

    rule_files:
    - /etc/prometheus/*-rule.yml

    scrape_configs:
...
    - job_name: 'ssl'
      metrics_path: /probe
      params:
        module:
        - "http_get_2xx"
        - "http_get_3xx"
      static_configs:
        - targets:
          - http://prometheus.io
          - https://prometheus.io
          - https://jd.com
          - https://www.bejson.com
      relabel_configs:
        - source_labels: [__address__]
          target_label: __param_target
        - source_labels: [__param_target]
          target_label: instance
        - target_label: __address__
          replacement: blackbox-exporter.monitoring:9115
...
[root@k8s01 prometheus]# kubectl apply -f prometheus-config.yaml
configmap/prometheus-config configured
重载prometheus配置
[root@k8s01 prometheus]# curl -XPOST http://10.x.x.x:30089/-/reload
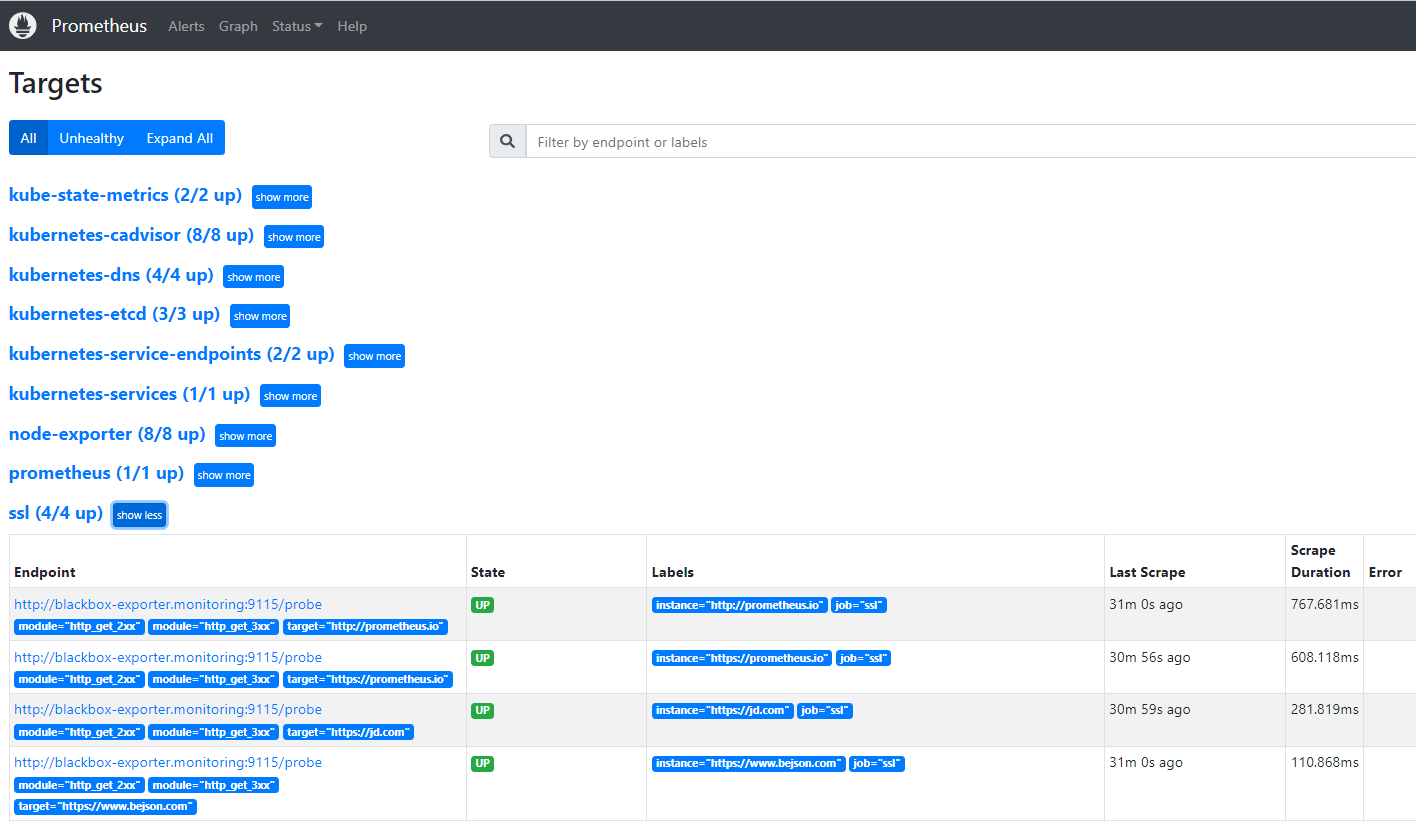
Prometheus UI界面查看
Targets显示如下信息,blackbox采集数据成功
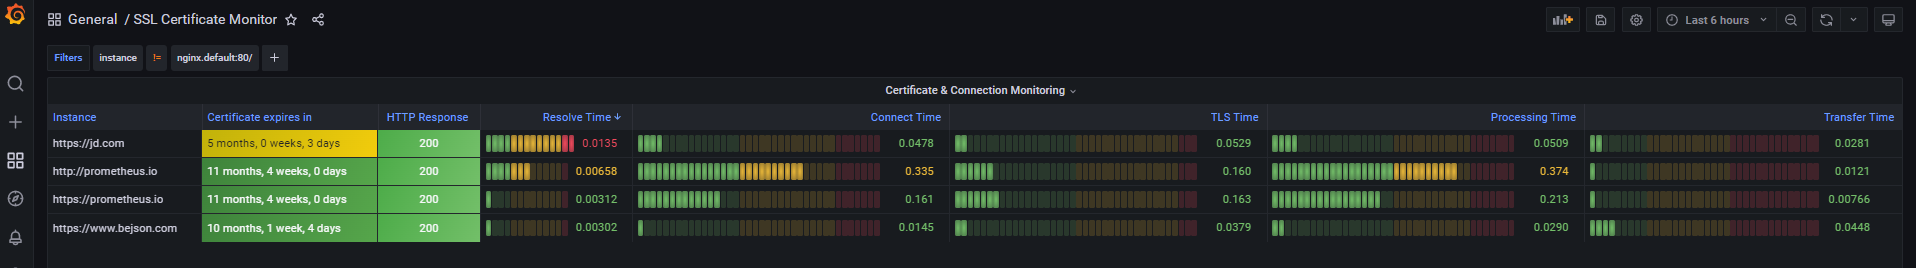
Grafana引入监控模板
登入Grafana界面,点击Grafana左侧栏菜单,选择Manage菜单,进入后点击右上角 Import按钮,设置Import的ID号为13230,引入模板,然后点击Load按钮进入配置数据库,选择使用Prometheus数据库,之后点击Import按钮进入看板
Prometheus配置告警
修改Prometheus的ConfigMap,添加对应的告警规则
[root@k8s01 prometheus]# vim prometheus-config.yaml
apiVersion: v1
kind: ConfigMap
metadata:
name: prometheus-config
namespace: monitoring
data:
prometheus.yml: |
global:
scrape_interval: 15s
evaluation_interval: 15s
external_labels:
cluster: "kubernetes"
alerting:
alertmanagers:
- static_configs:
- targets: ["alertmanager:9093"]
rule_files:
- /etc/prometheus/*-rule.yml
...
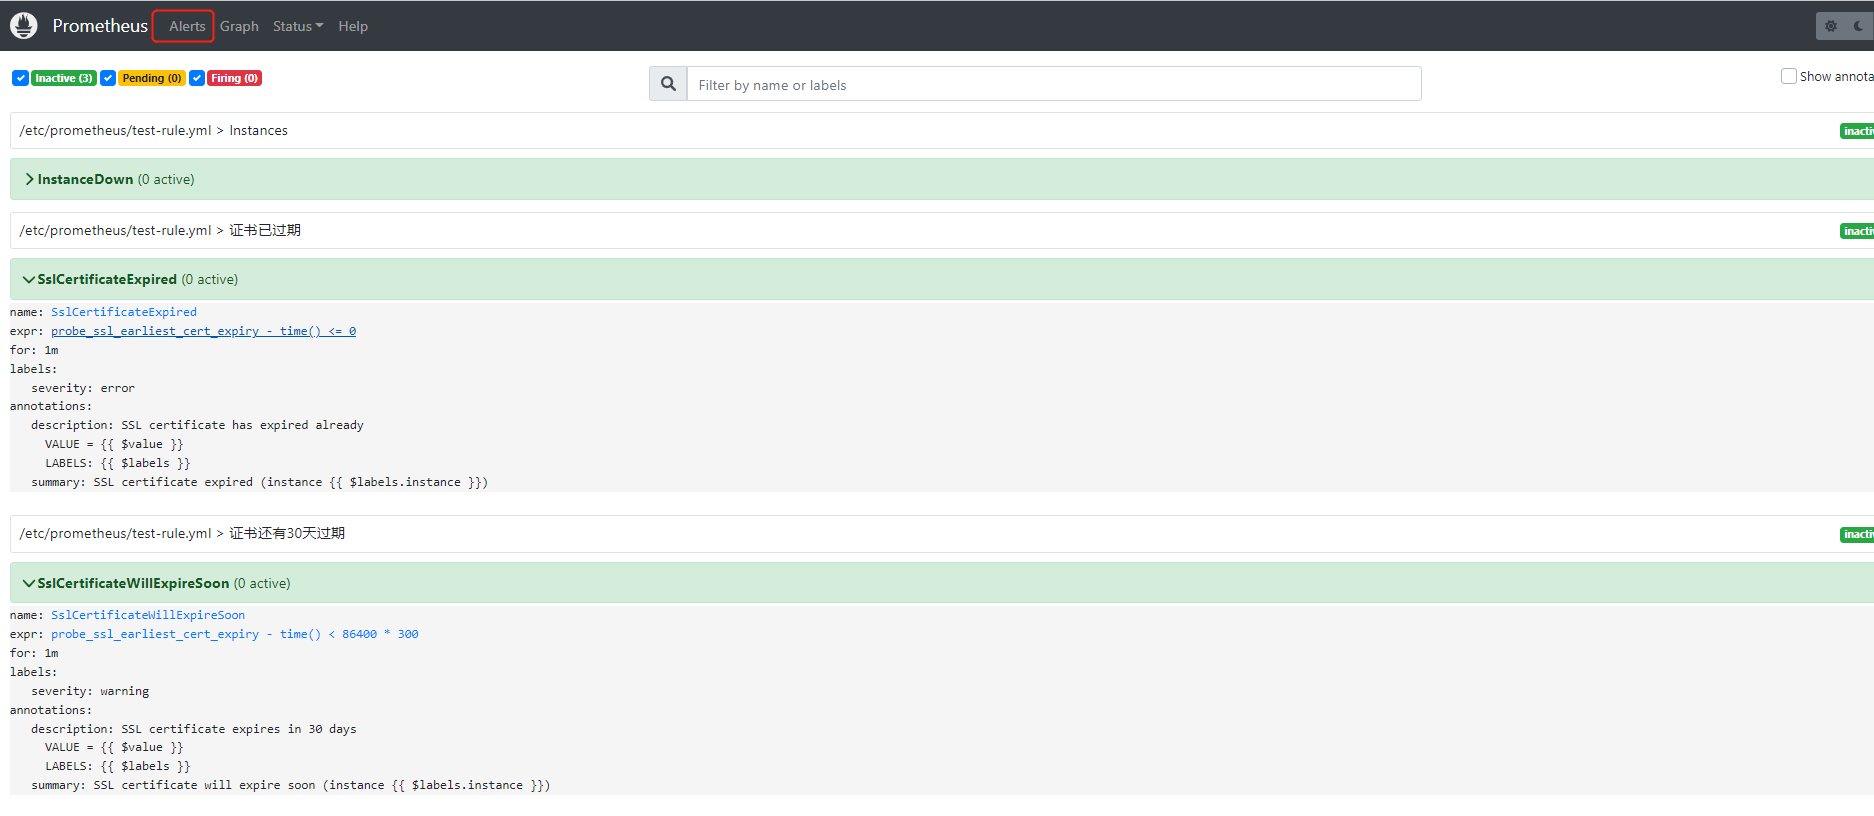
test-rule.yml: |
groups:
- name: 证书还有30天过期
rules:
- alert: SslCertificateWillExpireSoon
expr: probe_ssl_earliest_cert_expiry - time() < 86400 * 30
for: 1m
labels:
severity: warning
annotations:
summary: "SSL certificate will expire soon (instance {{ $labels.instance }})"
description: "SSL certificate expires in 30 days\n VALUE = {{ $value }}\n LABELS: {{ $labels }}"
- name: 证书已过期
rules:
- alert: SslCertificateExpired
expr: probe_ssl_earliest_cert_expiry - time() <= 0
for: 1m
labels:
severity: error
annotations:
summary: "SSL certificate expired (instance {{ $labels.instance }})"
description: "SSL certificate has expired already\n VALUE = {{ $value }}\n LABELS: {{ $labels }}"
[root@k8s01 prometheus]# kubectl apply -f prometheus-config.yaml
configmap/prometheus-config configured
重载prometheus配置
[root@k8s01 prometheus]# curl -XPOST http://10.105.x.x:30089/-/reload
查看告警是否生效
版权声明:
本站所有文章除特别声明外,均采用 CC BY-NC-SA 4.0 许可协议。转载请注明来自
爱吃可爱多!
喜欢就支持一下吧
打赏
 微信
微信
支付宝
 微信
微信
 支付宝
支付宝